
OUR IMPACT

RESOURCE FAMILY HOMES
2018 DATA
69 RESOURCE
FAMILY HOMES
2017 DATA
67 RESOURCE
FAMILY HOMES
BY RACE

African
American 6%
Asian 1%
Caucasian 1%
BY LOCATION

Moreno Valley, 52%
Banning, Rialto, Riverside, Beaumont, Fullerton,
Lake Elsinore, Corona,
27%
Perris 9%
Hemet 5%
San Jacinto 4%
Menifee, 3%
1,859 HRS
1,971 HRS
Hispanic 92%
RF TOTAL
TRAINING HOURS

Hispanic 94%
African American
3%
Caucasian 3%

Moreno Valley, 39%
Banning, Rialto, Riverside, Beaumont, Fullerton, Corona
Lake Elsinore
45%
Perris 6%
San Jacinto
6%
Menifee, 4%

BY RACE
Bi-Racial 9%
Asian Pacific 1%

Hispanic 53%
African
American
8%
Caucasian 29%
BY GENDER

Female 44%
Male 56%

Female
45.8%
Male
54.2%
BY AGE
Age 16-18, 4%

Age 0-5
47%
Age 6-10
25%
Age 11-15
24%

Age 0-5
46%
Age 6-10
27%
Age 11-15
24%
Age 16-18, 3%
HEALTH VISITS & IBO
IBO, 3%

Medical Visits
63%
Dental & Vision
34%

Dental & Vision
32%
Medical Visits
64%
IBO, 4%

2018 DATA
2017 DATA
268
PERSONS SERVED

Hispanic 45.8%
Caucasian
25.8%
Inter-racial
45.8%
American
African
13.3%
Asian Pacific 1%
NA 2%
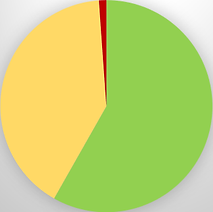
REASON FOR PLACEMENT

Family
Reunification
35%
Relative
Placement
36%
Adoption
14%
AWOL 3%
Others 4%
Emancipation 1%
Non-relative 7%

Family
Reunification
46%
Relative
Placement
23%
Adoption
20%
Legal Gaurd 7%
ILP/Transitional 3%
Non-relative 1%
BY CATEGORY

Neglect 93%
Physical Abuse 3%
Sexual Abuse 2%
No Provision/Support 2%

Neglect 76%
Physical
Abuse
11%
Failed
Permanency
7%
Others 3%
BY COUNTY
Riverside
58%
San Bernardino
41%
Sexual Abuse
3%
Orange County 1%

San Bernardino
35.2%
Riverside
64.8%
330
PERSONS SERVED
PERSONS SERVED
Staff Satisfaction Survey

Resource Parent Satisfaction Survey

Person Served Satisfaction Survey

Our survey findings found that 95% of our persons served are satisfied based on 240 responses with their home accommodations including food plus their clothing and allowances. They enjoy meals at home, chats with their resource parents about school and other activities and feel are they are listened too. They say their resource parents do a great job in collaborating with their Social Worker in supporting them.
Birth Families Satisfaction Survey

Overall results are 100% very satisfied based on 28 responses. Our Birth Families are very satisfied with the location and atmosphere of their visits, they are also satisfied with the support and treatment provided by CSKF Staff.
Our survey found that 98% of
our staff are very satisfied with their participation and involvement to the organization's mission and vision, goals, leadership support, team member work contribution, work environment,
work life balance and diversity.
93% of our Resource Parents
are either satisfied or very satisfied with the support
received from CSKF.
Non-Minor Dependents
Satisfaction Survey

Survey results found 90% of our non-minor dependents are very satisfied based on 10 responses.